To begin with, Fourier Transform analyzers and oscilloscopes are both valuable tools used in the testing of audio equipment, along with sweep generators, audio sine and square wave function generators, SPL meters, frequency counters and others. One shouldn't discount the use of one in favor of the other.
The Oscilloscope can show us what waves look like coming through an amplifier that math and graph drawing would do, values being obtained from an FFT analyzer, but instantly. Although FFT analyzers can print out graphical representations of the wave under test, a scope can give is a real time view.
But what is this view we get? I have seen printouts of FFT analyzers of complex waves from instruments that do not appear on an oscilloscope that way. Why?
First I will preface this article by saying that I do not have that much practical experience with FFT analyzers, but have also read about the technology, the algorithms and have seen the results. I have also read accounts of the experience of others. So don't laugh yet.
I will describe the functions of both, then the drawbacks of both, then make a comparison of them and why we should or shouldn't fully rely on the results.
THE OSCILLOSCOPE
The oscilloscope is a device that provides a visual representation of an electrical or acoustic wave (the acoustic wave is converted to an electrical one by means of a microphone or transducer of some sort). It does so by deflecting an electron beam that is being shot to the phosphor screen of a crt from a heated cathode. The beam is first horizontally deflected by a built in oscillator designed to provide a scan frequency which relates to time as represented by the grid on the front of the screen and the setting of the time switch on the front panel. The formula f=1/t (frequency equals the reciprocal of time) provides the relationship. What this does is allows us to view the wave at its level, namely a single cycle per time period.
When one sets up a scope one sets the time for the desired frequency, then inserts a signal. The external signal is introduced into the vertical deflection. This causes the beam to rise and fall at the rate of the input signal. The beam is now deflected both horizontally and vertically and the result, assuming a pure sine wave, is a sine wave picture that if set up properly should be one complete cycle from one end of the grid to the other. The wave can therefore take any shape depending on what is input to the scope.
This is useful in determining the amplitude of the wave, the frequency to a certain degree of accuracy (based on the time per segment of grid and how many grids a single cycle takes, or if the entire grid is one second, how many cycles fill the screen) and the type of wave seen.
This is very useful in audio applications in that one can see how a wave is distorted and where it begins to clip. The amplification of an amp can be verified by the amount of signal increase is noted. Linearity can also be somewhat checked by applying a stepped sweep and noting the amplitude of the output for each frequency. It is painstaking but effective to a degree.
However, one cannot see distortions below a certain value. I think the amount is about 3%. And it may take 1) a 100 MHz scope and 2) allot of experience.
However, the scope can show us things that may not make it through an FFT analyzer, such as crossover distortion, spikes and noise. Depending on the noise level, a scope will suffice.
THE FFT ANALYZER
In comes the FFT analyzer. This uses a digital computer for the Fourier transform in order to analyze the structure of a wave. Fourier theorized and correctly so that a complex wave is made up of a variety of sine waves in varying amplitudes and phases. The formula he came up with shows the thinking behind this.
This allows us to view complex waves in their simplest form and with what degree the other waves, in this case harmonics, are involved. One can get down to below 0.001%. In other words, if the sine wave has a distortion of 0.03%, we couldn't see it on a scope, but we can see it on an FFT analyzer. This is valuable in that we can now make amplifiers that can produce a very pure sine wave out for one put in.
The above percentage is merely a total harmonic distortion. However, the FFT analyzer can show us what percent of the source wave each harmonic is with relation to the main signal, or fundamental. This can be done regardless the type of wave that is input.
For example, if a square wave is input, the analyzer should show nothing but odd harmonics. If a triangle wave is input, it will show even and odd harmonics of a particular proportion.
SO, WHICH DO I RELY ON?
My opinion is both and neither. I did some experiments where I looked at distorted pure sine waves and then sources like a guitar and the voice. What I found was a bit confusing.
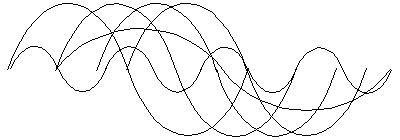
According to the Fourier Series, I
should be able to see, on an oscilloscope, the wave of a musical instrument
source such that it has a definite shape. However, what I saw was a bunch
of frequencies dancing all around. Sort of like this:
Of course it wasn't quite as coherent,
but I guess a snapshot of the scope would look like this. However, what
I expected to see was something like this:
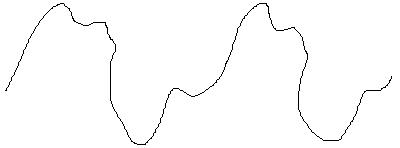
Again, not an accurate representation, but an idea. I do not see the above, but I have seen FFT analyzer printouts of similar tests, namely the image of what a complex wave would look like from an instrument. Oddly enough, if a pure sine wave were sent through an amplifier that distorted the wave as the above, I would be able to see it on a scope as above, and not as the previous image.
So I got very confused, which is really not too hard for me. Why can I view a sine wave with FFT analyzed harmonic distortions as a distorted wave, whereas I cannot view a tone from an instrument with similar harmonics as the above sine wave?
I posted this question on the news groups rec.audio.tubes and sci.electronics.basics and got back the following replies.
Before I get to the replies I will briefly summarize the combined conclusion.
It seems that when a string of a guitar is plucked, 1) the tension on the string is no longer constant 2) the harmonics are not really exact integer multiples of the fundamental 3) during decay, harmonic frequencies change, and 4) harmonics actually travel along the string. One of the explanations is that the scope will not trigger on a varying wave, but this has been argued down for two reasons. 1) The fundamental is constant and 2) I used internal triggering. Internal triggering is supposed to make for a stable wave.
I had grappled with this for quite
a while. I had used the scope to see AM RF, and it is the same thing. The
scope locked in on the RF, but the voice was a garbled jumbled mess as
opposed to a sine wave that is distorted. So, from the following excellent,
well educated and intelligent replies, you decide:
From: Roy McCammon
I can think of a couple or reasons:
1. the harmonics decay at different
rates
2. the harmonics are not exact integer
multiples
of each other or the
fundamental.
From: A. Douglas
Hi,
Roy McCammon answered:
>I can think of a couple of reasons:
>1. the harmonics decay at different
rates
>2. the harmonics are not exact
integer multiples
> of each other or the fundamental.
Yes, this is my understanding
also. The "harmonics" of a stretched
string are not exact multiples.
When tuning a piano, for instance, one
tunes the bass strings so their harmonics
agree with the upper strings,
not by their fundamental pitch.
If you have an old-fashioned Conn
Strobotuner, you can watch all the harmonics
simultaneously: some
are sharp, some flat, and as was pointed
out, they decay at different
rates too.
Cheers, Alan
From: "Bob Fitzgerald"
Hi Gabe -
My first reaction is you may be just seeing
an instrumentation thing
with the scope - that is, triggering a
scope on a somewhat transient
signal like a guitar pluck, versus a real
nice steady state signal like
a function generator. I assume you have
an analog scope, which cannot do
a single-shot transient capture like the
newer digital scopes. For this
experiment, you may be better off trying
to use your PC sound card in
"record" mode. Start recording,
then pluck the string, so you get the
entire wave form build up and decay.
What you should see is the fundamental
frequency defining the major part
of the wave form, as you would expect.
I'll try it myself and report back
if I see any weird stuff...
Make sure you use 44kHz 16 bit mode in
the card..
From: Michael Edelman
Bob Fitzgerald wrote:
> Hi Gabe -
> Thanks for adding your web page to the
bottom. A quick scan of it lets
> everyone know where you are coming from...
>
> My first reaction is you may be just
seeing an instrumentation thing
> with the scope - that is, triggering
a scope on a somewhat transient
> signal like a guitar pluck, versus a
real nice steady state signal like
> a function generator.
I would agree. If the previous poster plays
around with trigger level and
scan timing he'll probably find he can
get simpler wave forms.
From: Ken Redman
Hi,
I think the results you are getting may
be a product of the test method:
1) the guitar signal is being picked up
by a microphone and amplified:
this probably adds considerable mains
hum onto the signal that swamps
the tone from the guitar: try using an
electric guitar pickup and a well
screened/battery powered preamplifier.
2) with the signal from the guitar, the
oscilloscope is not
synchronizing its scan with the incoming
signal. A guitar produces a
'peak' when it is first plucked, decaying
steadily to silence. A signal
generator produces a continuous signal.
The latter is easy to
synchronize the 'scope to, the former
is not: you may get better results
if you put a fast AGC circuit after the
mic amplifier to reduce the
variation in amplifier output levels.
3) you are possibly seriously overdriving
the amplifier and clipping
your sine wave to a square wave. This
is 'low pass' filtered by the amp
to give a triangle wave. You will need
to be certain that you are not
overdriving your mic amplifier to get
good harmonic reproduction.
--
Ken Redman
From: Tim Reese
Gabe, certainly the 'scope requires a wave
form that is strictly periodic
in order to lock on the inherent period.
For a wave form to be periodic, it
must have a fixed frequency content over
all time (or at least a "long" time
in relationship to the spectral resolution,
i.e. like delta-omega delta-t is
about 1). I expect that when you
pluck a guitar string, or sing, the
frequency content of the note changes
as the note decays, it's not a periodic
wave form, and it appears as a changing
wave form on the scope.
From: Al Marcy
Hi RATs,
If you use a fast spectrum analyzer, or
a narrow band of a slow one( like me )
you will see the different frequencies
rise and fall as the string returns to
rest.
This lack of stability is likely a big
reason why sine waves are of limited use
in evaluating an amp.
My .02 pF
Happy Ears!
Al
B^}
From: Roy McCammon
The velocity of sound along the guitar
sting is not
a constant that is independent of frequency,
hence the
harmonics have frequencies that are not
integer multiples
of the harmonic or each other. If
the harmonic is close
in frequency to an integer multiple of
the fundamental,
you could model it as a harmonic at that
integer multiple
with a linearly increasing (or decreasing)
phase term.
That would look like a steadily changing
phase between the
fundamental and the harmonic.
I am told that this non-integer relationship
adds to the
richness of many musical instruments.
From: LGeoCole
The 'scope trace of a real sound usually
runs all over the
place.
Roy McCammon said:
>I can think of a couple or reasons:
>1. the harmonics decay at different
rates
>2. the harmonics are not exact
integer multiples
> of each other or the
fundamental.
If the harmonics are integral multiples,
the trace won't move
laterally. It will change shape
vertically if the harmonics
decay at different rates. Exception,
the 'scope trace may jump
sideways if the trigger level is
shifted by the decay.
A note from a musical instrument can be
very complex. The
"harmonics" may not be integral
multiples, leading to lateral
movements in the trace. This effect
is what gives brass its
raspy sound. Each "harmonic" is
higher pitched than integral.
A guitar has a lot of sound sources
other than the plucked
string. The other strings respond
to the shock of the one
string's pluck through the bridge
and nut. The body produces
various pitched resonances. Also,
a strings fundamental and
"harmonic" or overtone pitches can
shift during decay if its
elasticity or loading is not linear.
From: Darwin Diaz
The phrase "proportionally
descending amplitudes"
implies a geometric progression (series).
For example, if
the fundamental=1 unit, and a factor of
1/4, then the second
harmonic=1/4, third=1/16, fourth=1/64,
etc. This is not so
for vibrating strings. In fact,
the second harmonic of an
improperly plucked string (very big pluck,
bordering on
snapping the string) could be higher than
the fundamental.
```````````````````````````````````````````````````````````````````````````````````
The frequency
of a vibrating string is dependent mostly
on the tension on that string. Picture
a vertical string
with a set tension. Now the center
of the string is
displaced and released (plucked).
This will induce a
vibration on that string, on a plane longitudinally
with the
initial displacement. As the string
moves from its origin
(center) to a maximum displacement to
the left, back to the
center, then to a maximum displacement
to the right (less
displacement because of friction) and
then to the origin;
the tension will increase, then return
to its initial
tension, and then increase again, then
return to the initial
tension. In other words, for a vibrating
string, the
tension (therefore its frequency) increases
and decreases
twice for each cycle of string motion.
This is proven using
a deviation meter. An analogy will
be a rotating shaft that
drives an universal joint that drives
a second shaft bent
at an angle theta. If the input
shaft has a constant
rotational velocity, the output shaft
will speed up and slow
down twice for each input rotation (as
a function of angle
theta). My point is, that for small
plucking displacement
on a string (1/16 inch on a two feet string)
this change is
probably negligible by human ears.
If this signal (detected
by a laboratory microphone) is observed
on a properly
triggered scope, the period will not change
noticeably (rock
steady display) but its amplitude will
decrease
exponentially, much like the natural
logarithmic (Ln)
dampening of a tuned circuit (second order)
or a mass in
motion on a suspended spring.
- "Now I hook that mike up to an oscilloscope
and I see many
waves going up and down and back and forth,
but nothing real
coherent. This is typical of complex waves".
???
``````````````````````````````````````````````````````````````````````````````````
- "Why do I not see many waves standing
still on the scope,
making the same kind of shape that the
pure sine wave
makes?"
- "Why don't the waves stand still?
- "However, my answer to the above is that
from an
instrument, the waves are in fact not
standing, but the
harmonics are traveling, changing phase
from one moment to
the next, the fundamental being the only
standing wave".
What you see displayed
on the scope is ONE signal whose
instantaneous amplitude is the algebraic
sum of the
instantaneous amplitude of the fundamental
signal and all
its harmonics, and whose amplitude decays
exponentially {
1-e^f(t) }, in real time. For a
constant frequency source,
the "wt + theta" part on the Fourier
series remains
constant. But this is not so for
a vibrating string, whose
tension is a function of the instantaneous
position of such
string.
Do not confuse
standing waves with sound waves. If a
string vibrates at 1 kHz, you will see
an arced blur around
the string. This is called a standing
wave because it
appears to the eye as not moving, much
like rotating
propellers. This blur is caused
by the "persistence of the
eye" effect. But the string IS moving,
causing compression
and expansion of air, and this is called
sound waves.
Voltage does not flow and harmonics do
not travel (by strict
definitions). Again, the frequency
of a vibrating string is
not constant, it is being frequency modulated
in accordance
to the instantaneous distance of a string
from an origin.
"He who learns medicine from a book could
kill someone
because of a misprint"
Corrections are welcomed. Probably
half of what I wrote is
incorrect but it sounds good to me. "Enough
research will
prove any theory"
From: Darwin Diaz
```````````````````````````````````````````````````````````````````````````````````
- "certainly the 'scope requires
a waveform that is strictly periodic
in order
to lock on the inherent period."
True in mathematical form, there must be
a time interval. But a scope
should sync to a changing time interval.
If you connect a signal generator to an
oscilloscope, set it to any
frequency multiplier, at full vernier,
get a rock steady display on the
scope, and then
turn the vernier to minimum and maximum,
repeatedly and at different
rates, then the
oscilloscope will display a synch'ed display,
as varied concentrations
of the
trace, repeatedly. The oscilloscope was
able to trigger despite the
changing
delta w or delta t. It was implied that
the scope is a "triggered" scope
as opposed to W.W.II era "recurrent" scope.
- "(or at least as "long" time in relationship
to the spectral
resolution, i.e.
like delta-omega delta-t is about 1).
- "about 1".
Maybe about 1/2 (of t or w) according to
the Niquist rate. Two sample
points per
highest frequency cycle.
- "I expect that when you pluck a guitar
string, or sing, the
frequency content of the note changes
as the note decays"
Percussion instruments and string instruments
(that are plucked or
stricken as opposed to stroked with a
bow) are the only musical
instruments that exhibit this change in
"frequency content as the note
decays" <naturally, on its own>. All
bets are off for instruments that
produce a sustained note, and voice is
one of them.
From: Roy McCammon
Darwin Diaz wrote:
>
> The frequency
of a vibrating string is dependent mostly
> on the tension on that string. Picture
a vertical string
> with a set tension. Now the center
of the string is
> displaced and released (plucked).
This will induce a
> vibration on that string, on a plane
longitudinally with the
> initial displacement.
Here's a more detailed model. Right
before you release
the string, it has a displacement at each
point along the length:
- - - -
-
- - -
-
- - -
-
- - -
*
- - - *
this represents a string plucked at the
1/4 th point.
Lets assume this is vertical displacement.
You can view this displacement as the sum
of two displacement
waves, on running to the left and one
running to the right, both
"frozen" in time by the pick. When
the pick is released, the
two waves take off to the felt and right.
Each is reflected and
inverted when it hits the stop at the
end.
In the following, only the vertex of the
above waves are represented.
1 is the left moving wave, 2 is the right
moving wave
2>
<1
* - - - - - - - - - - - - - - - *
time = 0
<1
2>
* - - - - - - - - - - - - - - - *
time = 1/16 cycle
<1
2>
* - - - - - - - - - - - - - - - *
time = 3/32 cycle
2>
* - - - - - - - - - - - - - - - *
time = 3/16
1>
2>
* - - - - - - - - - - - - - - - *
time = 5/16
1>
* - - - - - - - - - - - - - - - *
time = 7/16
1> <2
* - - - - - - - - - - - - - - - *
time = 1/2 cycle
1>
<2
* - - - - - - - - - - - - - - - *
time = 9/16
<2 1>
<1
* - - - - - - - - - - - - - - - *
time = 11/16
<2
<1
* - - - - - - - - - - - - - - - *
time = 13/16
<2
2>
<1
* - - - - - - - - - - - - - - - *
time = 15/16
2>
<1
* - - - - - - - - - - - - - - - *
time = 1 cycle
So you see, an apparent up down motion
can be decomposed
into two waves traveling left and right.
As I have
illustrated it, the waves and all their
harmonics travel
at the same speed and decay at the same
rates so the
the harmonic structure does not change
with time. But on
a real string neither is true. The
speed of the harmonics
is different from the fundamental so that
the waves spread
out creating a rich and varying harmonic
structure that varies
with both time and position. No
surprise, that's why electric
guitars have pickups at different positions.
From: dangerdav
As you mention, where you pluck the string,
and where you pickup the
signal significantly affect the tone.
Another neat thing: As the string
vibrates, the tension is constantly
changing, and thus the propagation velocity
and pitch of harmonics on
the string.
Interesting the way real stringed instruments
make a very complex
smear of harmonics.
The last sentence really sums up the whole thing.
I have written a paper concerning the nature of sound on which a gentleman named Gary Jacobsen has collaborated with me. I have it here. It is still raw and I am putting some finishing touches on it but basically much of the above supports what I had written regarding what actually happens on the string of a guitar. I had come to the conclusion that these harmonic variations create a sub-harmonic. This is further verified by different forms of physics dealing with sub harmonics in nonlinear environments. Well, it seems that the guitar string among others are non-linear.
The conclusion here therefore is that neither the FFT analyzer nor the oscilloscope can give us precise measurements of how an amplifier will deal with these peculiarities. The FFT analyzer and a digital scope, where a freeze frame of the complex wave can be had, seemingly cannot give us an actual period by period representation of the original complex wave. How an amplifier handles these variations does not seem to at the moment be addressed.
There are many tests that have been devised relatively recently to measure an amplifiers performance based on phase relationships, pulses for peak power transient response, inter modulation properties and a host of others. But a truly complex wave from any instrumental source will introduce most if not all of these properties at once, if my assumption of the above is correct, namely that a sound from an instrument 1) produces harmonics that change phase from period to period relative to the fundamental, 2) have a condition similar to beating where the harmonics converge at 90 degrees every so often, which I would call a "sub-period", 3) this convergence will be a peak amplitude, like a pulse, which is a "sub harmonic" of the fundamental. One would also have to consider frequency modulation, inasmuch as the harmonics vary in frequency based on the tension of the string as it goes back and forth along its fundamental vibration.
Frequency modulation! Imagine that! But I would guess that the FM is occurring at the fundamental frequency. Just thinking about how complex the wave must look is taking me into a realm of fantasy!
I was speaking with a friend and fellow audiophile Sheldon Stokes about what I use as my benchmark, or reference "system". My guitar. If I can hear a reproduced guitar that sounds like my live guitar, I know I made a decent system. He agreed.
Also, if a complex signal is that messed
up to begin with, what difference will some harmonic distortion and phase
shift make in the final outcome? Not much. Not really. The resurgence of
2-5% distortion Single Ended tube amps is evidence of this. Also the demise
of the below 0.001% ditortion ratings war is a sign. If it sounds good
and real enough to us, that is what is imprtant. In my opinon,
that is.
I deeply appreciate the input from the gentlemen who kindly
added to the richness of this discussion.
Copyright 1999 Gabriel Velez